What Analysis is Essential to Improving your Crypto Trading
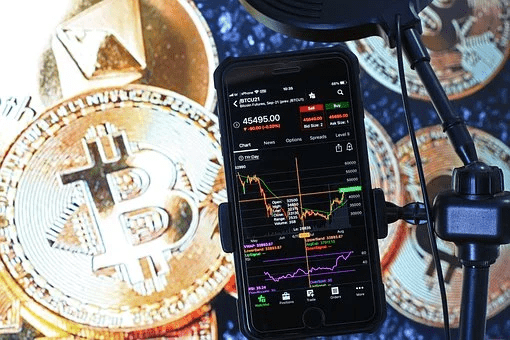
Every day we hear about cryptocurrency and which currency has gone up and which has gone down, and we always see Bitcoin prices fluctuating at incredible rates. We also see people around us make money from crypto trading, like the man who made $4 million from a $632 034 trade. All this makes us want to join in crypto trading as well. Or, if you are already trading but have not received substantial gains, you question how these success stories and what these traders know that you don’t know.
Trading of any kind requires knowledge, analysis and strategy, some trying and failing, and a lot of patience. So what do those successful crypto traders know that you need to know too? As mentioned, to analyze trends and what works and doesn’t work, there are various analyses one needs to do before trading or to improve your strategy. There are also tools available, like mt4 custom indicators and other apps you can use.
Technical Analysis
If you want to achieve consistent results, then you need to conduct technical analysis. Technical analysis involves evaluating statistical trends to predict which direction the price of the crypto will go; this is done by studying past price changes and volume data. Once you have studied this, you can predict future prices.
This analysis method uses these three assumptions.
- The market discounts itself. This assumption states that you don’t have to consider external factors when predicting the price movement of crypto. All you need to study is the price itself and nothing else that could affect price changes. For instance, if you notice a drop in the price of Ethereum, you don’t need to consider the economic climate but check its last price drop in history. You can then plot a chart from the previous fall and rise and predict the current price drop from that movement.
- The second assumption states that prices move in a trend, and the trend tends to repeat itself. So a future price movement will follow an existing trend, whether up or down or even sideways.
- The third assumption is that history repeats itself, so be it trends or price fluctuations, it is bound to repeat itself.
- Technical analysis is about looking at a currency’s past performance, comparing current and previous trends, and making predictions based on the data gathered there.
Popular Indicators in Technical Analysis
There are particular indicators and tools that traders swear by, and there is no guarantee that using these tools will reap millions for you. But they will help you make a more informed decision regarding your strategic trading.
1. Candlestick Chart
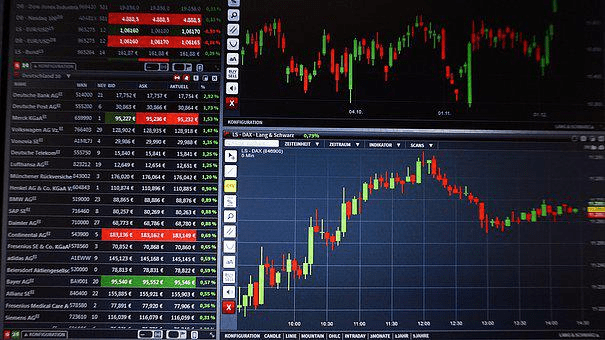
The candlestick chart comprises candle bodies and candle wicks, and the body can be green(increase) or red(decrease). The wicks show how high and low the price was within a specific timeframe, the tip of the wick indicates the highest price, and the base of the wick shows the lowest price.
Traders prefer this indicator because it shows more information about price movement within your selected timeframe.
2. Bollinger Bands
With this indicator, you can measure the price movement of currencies, and the band works on 20 days. This indicator calculates the average movement of the prices within that 20 days. If the result is above the market price, it indicates that the currency was overbought, and if it is below, it was oversold.
3. Trend lines
Traders draw out trend lines that form a pattern, and a trend line is a line that connects different price points on the graph. The more price points connect to a trend line, the stronger that trend is, and most likely, it will repeat itself.
Fundamental Analysis
The fundamental analysis is about looking at the big picture; it involves looking at the fundamentals of the asset. It considers information like a cryptocurrency’s financials, real-world applications, and user community.
With this analysis, you can determine if an asset is over or underpriced based on its future value, meaning it will still be viable and valuable. Take Ethereum, for example; it runs on blockchain technology. You assume that blockchain will grow and become more valuable in the future, and in conjunction, so will the Ethereum asset.
In addition to this analysis, there are other indicators you can check before making your crypto investments or trades. Social media is one of these spaces one can check for cryptocurrency trends, as prices can fluctuate based on an influencer’s backing.
Don’t always buy because it’s cheaper; sometimes, spending more is better if you want higher returns. The higher a currency market cap, the better it is for investment.
Always manage your risk wisely; cryptocurrency trading is riskier than conventional trading because of the high volatility of currencies. So invest with money you are willing to lose.
Finally
The technical analysis is extensive on market trends and looks at historical performances with the belief that they will be repeated. The problem with the technical analysis is that it doesn’t account for external environmental factors that could impact price movements. There is also the fact that history doesn’t repeat itself similarly.
Fundamental analysis is more future; it is about looking at a currency’s intrinsic value and then assuming it will increase or decrease in value. Again there are shortcomings to this analysis. For instance, how far into the future can you forecast? For instance, Virtual reality has been a talking point for almost five years, but the Metaverse is still in its infancy and could be another decade before it is fully functional. So as a Decentraland investor, how far into the future will you look?
Neither of these analyses is perfect, but they are necessary for improving your trading performance and potential earnings.

